Tuesday, July 31, 2012

Production falling faster than yields

Corn Yield:  139.4 bu/ac
Corn Production:  11,983 million bushels

Soybean Yield:  36.4 bu/ac
Soybean Production: 2,712 million bushels

Cotton Yield:  804 lbs/ac
Cotton Production 18.551 million bales


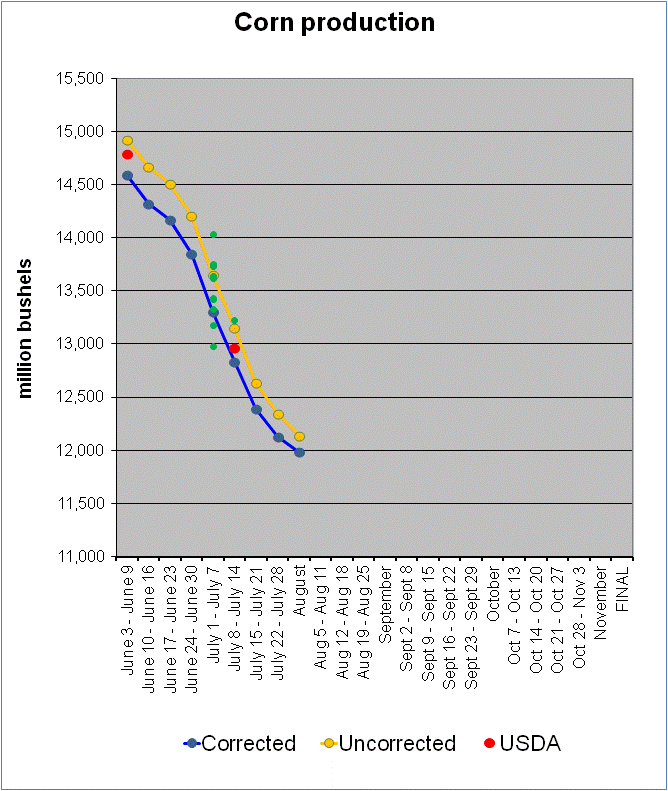
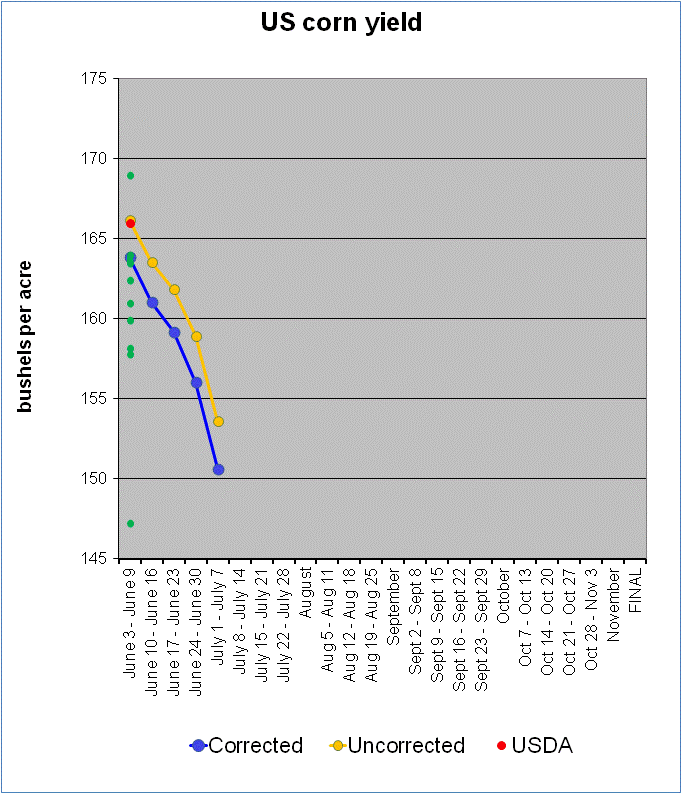
Production is falling faster than yields. Corn yields were down (only!) 0.4% this week while production fell 1.2%. This is of course due to abandonment as another 661,200 acres dropped out of harvest. As the worst acres drop out of harvest, this actually supports the crop yields taking the worst land out of the calculation. This is particularly true for cotton. For soybeans, the harvesting rate is much less sensitive to condition so the harvested area change is far smaller. 


I suspect I'm high on corn yields, harvesting rates and therefor production. The trade estimates are a good 7 bu/ac lower than I am now and probably a million acres + lower on harvesting rates. Harvesting rates in the US appear to have been rising over time, so it is hard to tell if we will see the 86% harvesting rates seen in 1988 and 1993. If so, that would put us at about 83 million acres harvested. But one might argue that ''normal'' harvesting rates have risen by as much as a couple percent over the last few decades. Right now I'm running an 89% harvesting rate, which I suspect is too high. If one takes an 87% harvesting rate with a trade estimate 132 bu/ac you could shave another 900 million bushels off my estimate, putting the crop right at 11 billion bushels. 


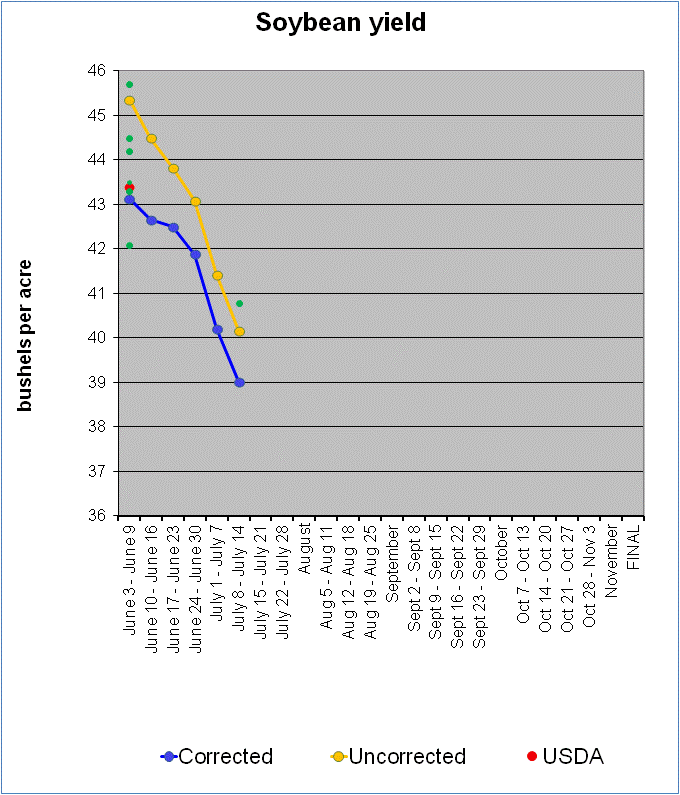
Soybean yields continue to fall with Iowa conditions making dramatic changes. I don't know if I should believe those numbers as I suspect I'm well below trade estimates on beans now, perhaps as much as 2 bu/ac with the crop contracting faster than corn over the last two weeks. 


For cotton, I'm not sure what to comment on this other than the experts got together recently and pegged the crop at about 16.5 million bales. Who am I to argue with the likes of Carl Anderson and O.A. Cleveland?  I think once again, the model doesn't handle the trade offs between yields and conditions in a place like Texas very well.  I'm a good 2 million bales above the experts at the moment. 


Monday, July 30, 2012

RIN carry and why I'm coming up with a different number than most


I think the original spreadsheet on my blog may actually be correct…..waiting on some confirmation, does anybody have a good contact at EPA? It isn’t a big deal this year bout would add about 150 million gallons (50+ million bushels) to the available RIN stocks. The difference between the two assumptions for point 3) becomes a BIG deal in future years.


I’m no longer convinced I’m wrong about 3) so the spreadsheet on my blog MIGHT ACTUALLY BE CORRECT and there are more than 2.640 billion gallons of maize rins possible for a carry forward….look at the EPA rules.
Note the percentages are nested and the RVO is NOT on the gap…..


This would mean if the carry in of advanced and sub-advanced wasn’t 20% then more than 20% of the gap could come in……. So the max carry is closer to the original one I had on my blog.


(---------------------ORIGINAL MESSAGE--------------------------)

Greetings from Rome.


This is my interpretation or I could just be wrong:

1)      First it isn’t that you can carry 20% OUT of last year into this year. It is that you can meet 20% of this year’s obligation with RINs from a previous year. That maters when the mandate is growing.  So if  the mandate last year was 90 and this year it is 100. Paulson’s calculation says you can carry out 90*.2= 18 when in reality it is that you can use 100*.2= 20  this year. So the 2520 constraint is incorrect.
2)      Pauslon uses net imports. He is correct in that exports lose RINs, you can’t export and then use those RINs for compliance. The problem with using NET-exports is that the imports are almost assuredly sugarcane ethanol which is by definition and advanced fuel. Unless the price of advanced RINS and conventional RINs are the same, you are not going to use those Advanced RINs to comply with the total mandate. So you should be using simply exports in the calculation.
3)      Finally, and this one seems to be not well considered is that the rule on carry is 20% of this year’s mandate can be met with last year’s RIN carry in.  Well there is no corn ethanol mandate despite what is constantly reported as a mandate which grows to 15bg. There is simply a gap in the total less advanced mandates that corn can qualify for. So the max carry-in isnt’20% times this gap as it isn’t even a mandate itself. It is 20% times the explicit mandates.   So how much corn could you carry in ? This is why there are those notes on the bottom of the graph about my assumptions of what was in the other classes. I’m probably wrong on those assumptions of how much other classes of RINs were available  but this is how the math should actually occur


You can find the language  as to why this appears true here http://www.gpo.gov/fdsys/pkg/FR-2010-03-26/pdf/2010-3851.pdf 
Search for the section D. 20% Rollover Cap. Notice the 20% applies to the RVOs of which there are no corn ethanol mandates.  So.

You have
Biodiesel mandate*20% = max biodiesel carry
Cellulosic mandate*20% = max biodiesel carry
Advanced mandate*20%=max advanced fuel carry
Total mandate*20% = max renewable fuel carry
There is no corn mandate so in theory that isn’t capped in the way everyone puts it forth.

SO the point is, if you don’t MAX OUT the carry from advanced fuels, this leaves more that corn ethanol can carry from the previous year.

Advanced mandate = 2000
MAX advanced carry in is then 400 million gallons
Total mandate = 15200*20% = 3040 million gallons.

So if you were carrying in a FULL compliment of advanced RINs the amount of maize RINS you could carry would be 3040-400=2640.
However, given the fraudulent biodiesel RINs (and the weird vintage price inversion in RINs it caused), the fact that we had no cellulosic production and the fact that imports don’t look so large as to say we filled up the 400 million gallons, then we have greater room for maize ethanol to make compliance. So let’s say we carried in 100 million gallons of all advanced fuel types into 2012. That means we could carry in

3040 – 100 = 2940 million gallons of maize ethanol RINS to comply with the total and we would have used a total of 20% of last year’s RINs to comply with the total mandate.  The Real trick in this calculation is to know what the carry out was for all advanced fuels, but the number thrown out as the maximum that maize could under any circumstances carry forward is not that it could be higher.


*as an aside, could over carry advanced and then be forced to use it to comply with the total renewable mandate but they wouldn’t be worthless.  

Tuesday, July 24, 2012

Soybeans 36.8 bu/ac Corn 140 bu/ac Cotton 19 million bales

First some house cleaning. My guess that there were three changes that needed to be made in the RIN calculations (a few posts down) may be wrong for one of the assumptions. This only matters to those folks who follow RIN stocks closely.


It seems that the EPA in setting the 20% cap applies it to the RVO  not the mandate levels themselves, and since the RVO is on the gap between the total renewable and advanced mandate THIS WOULD CAP CORN RINS INCOMING FOR 2012 at 2,640 million gallons (not 2779 as below).


From a policy standpoint this decision by the EPA to implement the rules in this way creates less flexibility than if the 20% were applied to the nested mandates and not the gap. In this year and in a future drought year it could make a big difference.


ON TO CROP PRODUCTION AND YIELDS

Corn Yield:  140.0 bu/ac
Corn Production:  12,130 million bushels

Soybean Yield:  36.8 bu/ac
Soybean Production: 2,746 million bushels

Cotton Yield:  811 lbs/ac
Cotton Production 19.035 million bales

The big news this week is in soybeans where yields fell another 1.2 bu/ac (or 3.2%) with production falling to 2.476 billion bushels (or 3.3% , abandonment response is very low in beans). In looking at the individual state movements, Iowa conditions took a significant downturn in soybeans this week. The path is consistent with other surrounding states (down!) but the drop was huge! I'm a little skeptical of this move (or I should say the model's response). 10% of the crop fell from good down to poor and very poor, skipping fair condition altogether.


This follows the moving focus towards the bean crop as the corn crop has already taken a beating. For corn this week I ''only'' dropped another 1.9 bu/ac to 140.0 bu/ac but I think the market is trading in the range of 135-137 bu/ac. I've got production of 12.12 billion bushels. I think the issue of abandonment (see below) is keeping my production number up beyond what I think is currently realistic along with the issue of percent vs absolute deviations in the model.


For cotton I remain 2 million bales above the USDA. I'll have to see what Dr. Carl Anderson, Dr. O.A. Cleveland or Dr. Gary Adams are saying to determine how far off I think I am. The information I'm hearing is I'm not even in the same city, let alone neighborhood. This project was started to try to get a handle on cotton yields and production and while it has done a good job for corn and soybeans, its success in cotton has been quite variable.Once again, cotton is causing me significant trouble.

ABANDONMENT


When estimating equations, conditions didn't always come in as significant in the abandonment equation for corn in places like Iowa and Illinois even though we saw a dip in harvested area in 1988. I did drop 735,000 acres from harvested area on this drop in conditions and I'm now under a 90% harvested to planted area but I think it is likely that this number is still to high (historically it was 86.0% in 1988 and 85.9% in 1993). This means that the equations are probably overestimating harvesting rates for a few states by 1-3 percent (maybe more) and this will directly effect production by something a less than that percentage (as the model estimates planted area yields and some of the stuff that was on the lower end of the condition scale is the stuff that is abandoned). I have no reason to doubt harvested area numbers in the range of 84 million acres that I'm seeing reported.


Monday, July 23, 2012

Only 2 errors on RIN calculation?

This isn't clear to me, my original calculation below may be fine as the RVO is on the mandates NOT the gaps.....

Text from EPA


To implement EISA’s restriction on
the life of credits and address the
rollover issue, the RFS1 final
rulemaking implemented a 20% cap on
the amount of an obligated party’s RVO
that can be met using previous-year
RINs. Thus each obligated party is
required to use current-year RINs to
meet at least 80% of its RVO, with a
maximum of 20% being derived from
previous-year RINs. Any previous-year
RINs that an obligated party may have
that are in excess of the 20% cap can be
traded to other obligated parties that
need them. If the previous-year RINs in
excess of the 20% cap are not used by
any obligated party for compliance, they
will thereafter cease to be valid for
compliance purposes.


Link to EPA rule making
http://www.gpo.gov/fdsys/pkg/FR-2010-03-26/pdf/2010-3851.pdf


Relevant Text

Wednesday, July 18, 2012

Available RIN stocks for 2012?

UPDATE:
It seems that the EPA in setting the 20% cap applies it to the RVO  not the mandate levels themselves, and since the RVO is on the gap between the total renewable and advanced mandate THIS WOULD CAP CORN RINS INCOMING FOR 2012 at 2,640 million gallons (not 2779 as below).

From a policy standpoint this decision by the EPA to implement the rules in this way creates less flexibility than if the 20% were applied to the nested mandates and not the gap. In this year and in a future drought year it could make a big difference.


I've seen questions and calculations of the availability of RIN stocks and how the industry may use this supply of 2011 conventional RINs to comply with 2012. Those are two very distinct questions as we don't have much of a history to go by in determining RIN stock holding behavior.

As I've said I've seen several RIN stock holding calculations including this one from the University of Illinois that contains at least 2 errors when it comes to application of the mandate policy..... Fortunately for them some of the errors are offsetting! I started from their table and fixed the errors I noticed. This isn't a big difference (200 million gallons of ethanol or so), however, the errors in the their calculation will become MUCH more problematic in future years!  

(Click on the table to enlarge)

 Calculating the RINs is the easy part of the calculation, determining RIN stock holding behavior is the bigger question.

I'd recommend THIS article out of Missouri if you want to understand RINs. You should be able to find the errors in the U of I calculation after reading it and also figure out why they might be a bit deal in the future. The RIN carry COULD be a big source of corn price stability depending on the elasticity of demand for RIN stock holding.


Monday, July 16, 2012

Lost another 4 bushels in corn and 1 bushel in soybeans


Dropped another 4 bushels of corn and 1 bushel of soybeans. I keep having to change the scale on the corn yield graph as it goes lower and lower. Please consider the post before this one and how my use of absolute deviations (vs percent deviations) from normal yields and how some may think this will end up giving be a distorted estimate of yields Notice too that harvested area is beginning to fall, that is why when yields fell 2.8% this week production fell by 3.4% as I dropped a half million acres out of harvesting. This can actually stabilize yields all else equal (which it usually isn't). I mentioned the difference between absolute and percent deviations which will be tested this year, but also, I've never been able to get any significance out of the condition data on corn harvesting in Iowa, but I can visually observe that in 1988 the harvesting rate was 94.6% while the 1986-2011 average is 97.1%.   There has even been a slight upward trend over time. The result for me is that I have a 97.7% harvesting rate for Iowa. So there is the potential for a few percentage point cuts in production in Iowa on this issue. The same is true for Illinois (no trend in Illinois but the harvesting rate in 1988 was 96.9% and the long run average from1986-2011 is   98.3%. The same holds for Indiana where harvesting rates are NOT condition driven. I simply haven't been able to get any significance out of the data, but I bet this won't be the case next year. For some states I do have condition variables which are significant so harvesting rates in Nebraska have fallen from 98.1% of planted acres several weeks ago to 95.7% in the most recent week. This will often give you a larger decline in production than in the estimated yield. Missouri shows a similar decline from 96.6% to  95.1% over the same period. 

Corn Yield:  141.9 bu/ac
Corn Production:  12,350 million bushels

Soybean Yield:  38.0 bu/ac
Soybean Production: 2,839 million bushels

Cotton Yield:  806 lbs/ac
Cotton Production 18.875 million bales


GREEN DOTS are trade estimates at the time they were issued


Friday, July 13, 2012

Comparison to 1988?


Having pulled earlier than current weeks, the point I was trying to make is that I almost can’t get the kind of deviations seen in 1988 because of the way I’ve structured the model. The conditions are equated to ABSOLUTE yield drops. So when an acre goes from Fair, to Poor, this means that acre drops by a yield volume, not a percent of trend yield. Will that be important this year? I don’t know. This only becomes important in the most extreme years. So to get a 39% drop in yields this year would take far worse conditions than in it did in 1988 given the way the model is structured. 


This comparison to 1988 with the large reduction in trend yields got me thinking last night so I did some calculations last evening with the model, which for whatever reason predicted the USDA maize yield exactly for this month’s report (and so it provides a good starting point for a comparison to 1988).

First let me state the problem with a simple comparison to 1988 was that conditions at this time of the year were better than they are currently for this point in July. No! they declined substantially in the July 10th report to the following....... 

For this week in July in 1988, conditions were as follows

Very Poor-18%
Poor-32%
Fair-36%
Good-16%
Excellent-2%

They currently stand at
Very Poor-12%
Poor-18%
Fair-30%
Good-34%
Excellent-6%

After the big drop the crop didn't change much after that
and this was the condition of the crop in August-September and I used this in the following calculation. 
Very Poor-16%
Poor-36%
Fair-30%
Good-15%
Excellent-3%

Definitely things ended up worse than where things stand now.


So I did some simple experiments taking out trends in yields, putting in 1988 conditions (for states that were reporting then as maize area has expanded, if no data were available I included current conditions) and also putting in 1988 area (as the geographic mix isn’t irrelevant given maize’s movement and the 42% larger corn area in 2012 than in 1988!  )

The ACTUAL yield in 1988 was 84.6 bu/ac.


When I take the model and put in available conditions from 1988, take out the trend back to 1988, and put in the area from 1988 I get 85.7 bu/ac so the model seems to replicate history fairly well, off by only 1 bushel.

If we come forward, putting back in the trend, put in the current planted area, so the only  thing that is different is I’m putting in conditions in 1988 in the model for those states available I get the following


Early September conditions from 1988 = 137.2 bu/ac  (Before the big drop in conditions in 1988 I would get about 157 bu/ac). 

I don’t get anything close to a 39% decline from trend discussed in the article even with conditions as ‘’bad’’ as 1988, a significant part of this would be the assumption embedded in the model which assumes absolute deviations based on conditions instead of % deviations, itself an assumption that the crop is better able to handle abiotic stressors than it was 1988. The outcome for crop yield distributions (the coefficient of variation) is a heavily debated one*

Given historical USDA behavior and accumulation of crop damage, we could possibly see yields fall further, but I would be shocked if we hit 1988 style deviations. Of course as I do this primarily as a hobby I could be way off!


(the specification of the model implies constant absolute deviations based on condition, not percentage deviations based on conditions, which shows my own personal bias)
(the model calculations above are the average of either weeks 9-10 for current conditions or weeks 19-20, mid September, for final conditions. )
(I did NOT adjust planting progress to 1988 numbers which does impact final yields and probably gives a small unwarranted boost to yields for this year). 

Tuesday, July 10, 2012

Race to the bottom, Corn yield 146bu/ac Soybeans 39bu/ac and cotton holding at 18.8 million bales

Yet another week of big declines and a race to the bottom edge of the trade estimates I've seen recently although with each new release the trade moves further down. Remember, these are subjective data and, in my opinion, sometimes captures peoples ''feelings''. But make no mistake, in some places (locations in Illinois and Indiana for instance) things are clearly very bad. See a state by state comparison below to see the geographical effect of the drought.  (spreadsheets with all state numbers for corn, soybeans and cotton available on request). 


Corn Yield:  146.0 bu/ac
Corn Production:  12,789 million bushels

Soybean Yield:  39.0 bu/ac
Soybean Production: 2,920 million bushels


Cotton Yield:  800 lbs/ac
Cotton Production 18.886 million bales


We have had continual declines in yields in Illinois and Indiana but we are starting to see some declines in Iowa. While the corn still looks reasonably good back home (Eastern Iowa) but worries are mounting. If we look at the graphs by state below you can see that up until recently the model was holding Iowa corn and soybean yields pretty stable, they have begun to decline in the last couple of weeks as temperatures have risen and drought conditions expand. Should conditions improve or stabilize, the farmers in Iowa and Minnesota might have both a decent crop and benefit from the nice run up in crop prices. This will come at the expense of farmers in Illinois and Indiana. While it did rain in Champaign (IL) I don't get the impression that it was sufficient to change the story-line.  NOTE that I use Nebraska for corn and Missouri for beans in the state breakout graphs below, and again, spreadsheets available on request. 


Tuesday, July 3, 2012

What is rising faster than corn prices? RIN prices


RIN prices, the tool to show compliance with US mandates are still cheap but have risen by over 60% in the last two weeks, far more than maize prices themselves. It looks like the biofuel sector is taking notice and starting to ration itself. RIN carry was very high into the year and so with this short crop we have that quantity to play with in reducing maize consumption this year. With the way the mandates work and some approximation of carry in, there is about 25 million metric tons that could be cut from biofuel maize use. Now it won’t be that large, folks won’t want to expose themselves to the risk of carrying out NO RINs into 2013, but we could see a reduction in RIN stocks and thus less maize demanded than would be determined strictly by equating the mandate gap with the maize needed to fill it and a decline in use of maize for ethanol is certainly a strong possibility. Add to that the little understood fact that the carry in limit applies to totals and not the gap created for maize and that is another (admittedly small) 3.5 million metric tons of play in maize demand.


RIN prices in the 2012 vintage have moved up from a recent low (not giving exact prices) of just over 1 cent a gallon go just under 2 cents a gallon in the last couple of weeks. Seems to me there is some upside potential in this market, of course there is always the risk the EPA could wade in with a waiver cutting RIN holders off at the knees if things get bad enough.......

Some Math at the extreme (and in bushels!)


My math was off in the metric tons calculation so I’ve fixed it.
I’m going to talk in calendar year because that is the mandate timing, you have to convert back to guess at the effect in crop years, so I’ll use a standard conversion and the calendar numbers.

If your corn grind is 4.82 million bushels (2.74 gallons per bushel) to make the conventional mandate gap (this gap in the mandates that maize starch ethanol can access) of 13.2 billion gallons, then this represents a use with no flexibility or RIN carry. However there is 20% RIN carry in allowed and we most certainly over produced for the 2011 mandate. BUT it isn’t 20% of the 13.6 mandate because that isn’t really a mandate, it is a GAP in the mandate system. It is really 20% of the individual mandates and you can’t exceed 20% carry in on any of them individually or in the total. So let’s see what we have with respect to the other mandates, probably zero carry in for cellulosics, we probably didn’t import much more than we needed for the 2011 obligation (tariff effect?)  and with all the fraudulent biodiesel RINs and the weird inversion of 2011 to 2012 vintage biodiesel RINs prices I doubt we had much of any carryover of biodiesel RINs into 2012. So if we ignore those (say the advanced and sub-categories RIN carry are zero), the amount that you could use of maize based ethanol RINs carried in from 2011 isn’t   ( 0.2*13.2billion gallons) = 2.64 billion gallons of RIN carry but the whole total of (0.2*15.2billion gallons) = 3.04 billion gallons of RIN carry potentially. So at the extreme, if you have zero carry in of non-maize biofuels and you carry out zero RINS into 2013, there is 3.04/2.74*1000 =  1.1 billion bushels  (28  million metric tons) of play in the demand for maize to produce biofuels.  This is of course at the extreme because it probably wasn’t zero carry of non-maize RINs into 2012 (but I bet it isn’t large) and at the same time, I don’t know for certain how many conventional (maize based in this case) RINs were carried into 2012 but you could approximate this. Also folks won’t want to carry in zero RINs into 2012 so they won’t run RIN stocks down to zero, but at any rate, there is room for some rationing on the ethanol side!

So 4.82 billion bushels needed? What fraction of the 1.1 billion bushes it could potentially be reduced exists and is reasonable? (again, I think this is a very large fraction) and how much are folks willing to draw down RIN stocks (the bigger question and why RIN prices will be interesting this year)?

I’m not going to yet guess what grind will actually be.

Seth


Declines accelerating and spreading with drought impacts for corn

Corn Yield:  150.6 bu/ac
Corn Production:  13,255 million bushels

Soybean Yield:  40.2 bu/ac
Soybean Production: 3,010 million bushels

Greetings from Rome everyone:
It has apparently been more mild and cool here in Rome than has been experienced across the Mid-west this past week. I’ll set aside that apparently there was more snow accumulation in Rome than in Columbia MO this winter too!

The acreage report had little impact on corn production despite the increase in acres as the geographic shuffling of acres out of Iowa and into Illinois and Indiana where the drought was having the largest effect resulted in little production change. This week we see declines across the board, including Iowa, as the decline in yields and production gain speed. These are of course subjective measures and they tend to be influenced by short run events on occasion (cotton conditions and hurricanes is a good example*) so we will see how these numbers hold into next week. I will say that the effects appear to be spreading with a large decline in Iowa this week although still smaller than the declines in Illinois and Indiana again.

*I keep trying to find time to do additional commentary but as this is for my own entertainment, I’m limited in the amount of time I have. Remember, these are subjective data. A few years ago, when a hurricane came ashore, cotton conditions fell for two weeks then quickly rebounded. The short run extreme weather event colored folks perceptions of the crop. Now the drought is pretty severe so I’m not suggesting a jump back up next week, but it will be interesting to see if the declines continue so strongly in the next two reports.