Tuesday, August 23, 2011

Big declines in corn and soybean numbers

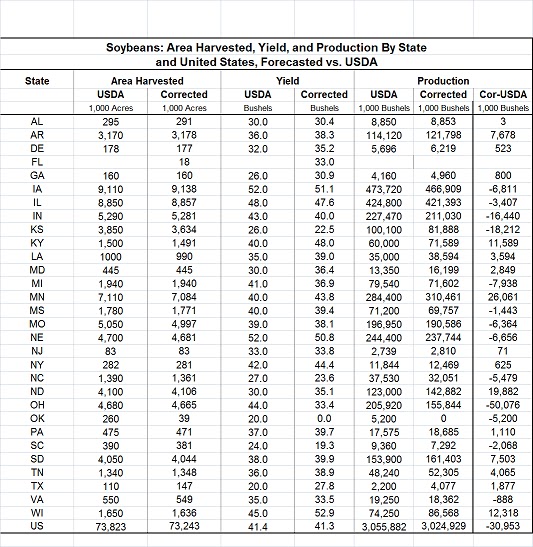
We saw significant declines in corn and soybean yields the last few weeks. For corn, my new number would be in the middle of the trade range but I have one observation from the trade this week that puts yields down at 150bu/ac, I'll have to adjust my graph axis! For soybeans I was well below the trade but very close to the USDA estimates. The only current trade estimate from this week is spot on with my results from this week. 

For cotton, well, the model simply blows Texas and it is clear that the situation there is not one we have seen in the last 27 years as there is nothing like it in the data. I don't like to mess with the model based on some arbitrary adjustment so I'm leaving it as is knowing I'm off track on that estimate. (clicking on the tables and graphs below will take you to an enlarged version).


Thursday, August 11, 2011

USDA comparison

Graph comparisons are below the tables, here are the state by state comparisons with USDA estimates. I'm on the high side in corn, but so was most of the trade. The big (absolute) differences here seem to be in Iowa and Indiana where I'm significantly higher.

I'm spot on for soybeans well below the trade. For cotton, the difference appears to be Texas. I began this whole effort to try do a better job in cotton production. This will definitely be a year to include in the estimation period.

Note: Thinks are bad enough in Oklahoma for soybeans that it essentially wipes out production (yield wants to go negative!). This week, 87% of the crop was in poor or very poor condition so I've essentially dropped production out entirely. It isn't large enough to have a substantive effect on the total. 


Click on the table to get a larger view


Tuesday, August 9, 2011

Top of the trade range for corn, below the trade range for soybeans

I'm at the top of the current range of trade for corn, but I'm below all trade estimates for soybeans. Look at several states including Illinois in beans you can see why numbers are coming out where they are. I'll do a state by state comparison as usual when the August numbers come out. Spreadsheet Aug82011.xls


Monday, August 1, 2011


SPREADSHEET Aug12011.xls

I'm at the upper end of the corn trade estimates for yield. This is the third week of declines and the corrected model declined another 0.5 bu/ac this week. Corn production is at 13.3 bb which is also probably at the higher end of trade estimates.

For soybeans I'm considerably lower than current USDA estimates. I'm over 2 bu/ac lower on yields and about 200 million bushels lower on production. I don't have trade estimate numbers for comparison.

For cotton, I'm fairly confident I'm simply 'wrong'. The model isn't able to handle the conditions in Texas where the harvesting rate may be below 50%.